Flyback Friday: Bellanca Comes Home
Share

Look up at O‘ahu’s blue skies and you might just be lucky enough to spot our maroon, single-engine Bellanca, the iconic aircraft that started it all for Hawaiian Airlines. This week in history, we’re celebrating the aircraft to which we trace our long-time legacy as Hawai‘i’s hometown carrier.

It all began in the spring of 1928 when isle businessman Stanley C. Kennedy convinced the board of Inter-Island Steam Navigation Company to expand into the airline sector. A visionary, Kennedy believed air travel would inevitably overtake ships as the main mode of passenger transportation between the Hawaiian Islands.
His tactic to get the fledging Inter-Island Airways Ltd. off the ground? Introduce locals to the wonders of air travel by offering sightseeing tours of O‘ahu aboard his new acquisition: The Bellanca CH-300 Pacemaker, a five-passenger, 300-horsepower monoplane with a fabric-covered metal frame and wooden wings.

The Bellanca was purchased from Delaware-based manufacturer Bellanca Aircraft Corporation, where she was flown cross-country to San Francisco and shipped to Hawai‘i. She first took to the island’s skies on Oct. 6, 1929, when it carried 76 passengers on trial flights. Inter-Island Air Service was officially inaugurated on Nov. 11, 1929, with the Bellanca logging nearly 50 flight hours that month.
From 1930-31, the Bellanca fulfilled the mission set by Kennedy, giving more than 12,000 guests – six at a time – a birds-eye-view of O‘ahu for three dollars (approximately $43 today) a head. By 1933, the Bellanca was pulled from commercial service and sold. The aircraft made its way to Alaska, where it would haul cargo – such as 55-gallon drums of fuel and bear cubs, deliver supplies to villages, transport injured minors and double as a seaplane.

Back in the Islands, Kennedy’s vision had become a reality, with Inter-Island Airways renamed Hawaiian Airlines in 1941.
Two decades later, Bellanca was put out of commission after crashing into a lake in British Columbia. The mangled plane suffered severe structural and mechanical damage and was later taken under the care of an aviation enthusiast in Oregon. The rest is somebody else’s history to tell…well, until 2009.

After learning the plane was for sale, former Hawaiian Airlines President and CEO Mark Dunkerley and a handful of company pilots set out on a mission to re-purchase Hawaiian’s most prized piece of history.
“When we learned Bellanca was up for sale, we did everything we could to bring it home,” shared Capt. Rick Rogers, Hawaiian Airlines archivist and former pilot.
The company quickly re-acquired the aircraft and embarked on an ambitious restoration project on the mainland. In late August 2009, she was certified airworthy after a successful flight to the state of Washington and returned home to the Hawaiian Islands.

Bellanca has since undergone another major restoration and remains one of the only remaining Bellanca CH-300 Pacemakers in the world that still fly. Today, it’s a source of Hawaiian Airlines’ pride, giving employees personal sightseeing tours around Honolulu. (Talk about an employee perk!)
“Bringing that airplane back was an incredible time for our company and – to this day – it continues to be the crown jewel of our fleet,” added Capt. Rick. “If you happened to pick the right flight, you could even get former company CEO Mark Dunkerley as your personal pilot and tour guide.”

So go ahead and look up next time you’re enjoying Honolulu’s sunshine, and if the sky is cloudy, listen closely…you’ll likely hear Bellanca’s historic hum traveling through the island’s airspace.

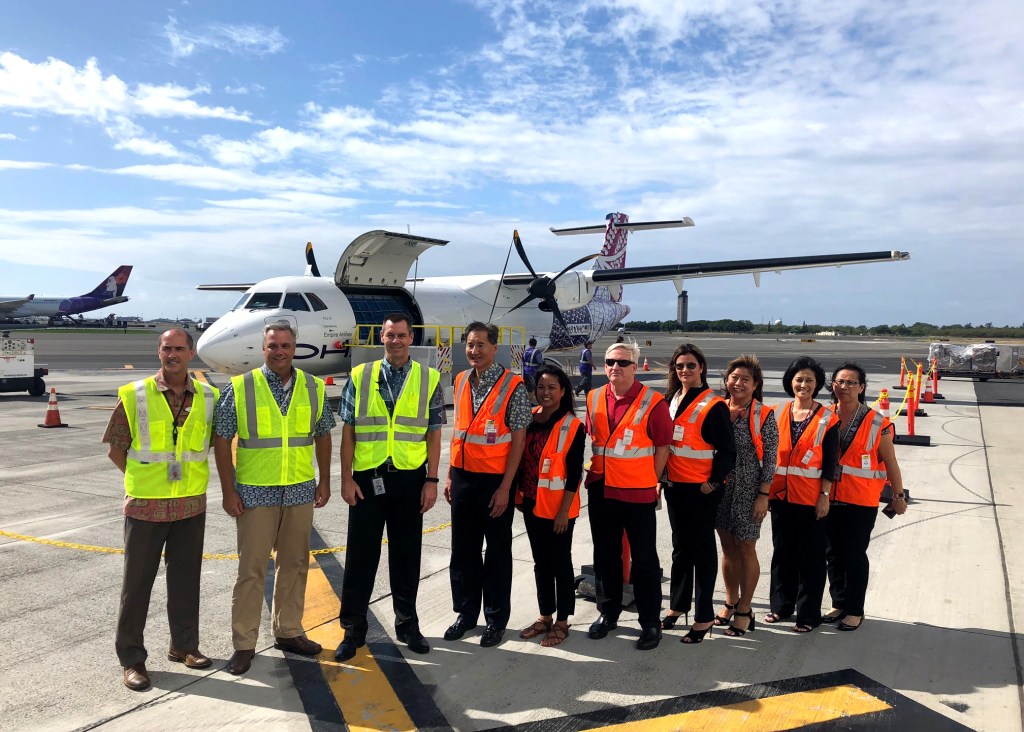
 Brad Matheny, managing director of cargo operations at Hawaiian Airlines, Brent Overbeek, senior vice president of network planning and revenue management of Hawaiian Airlines, Peter Ingram, president and CEO of Hawaiian Airlines, Steven Ai, president and CEO of City Mill, Brandee Menino, CEO of Hope Services Hawai‘i, Stephen Spears, executive director of Kaua‘i Habitat for Humanity, staff with Hawaiian Airlines accounting team who donated school supplies.")