What goes into 7 parades: long hours, hundreds of Alaska employees — and boundless Pride
Share
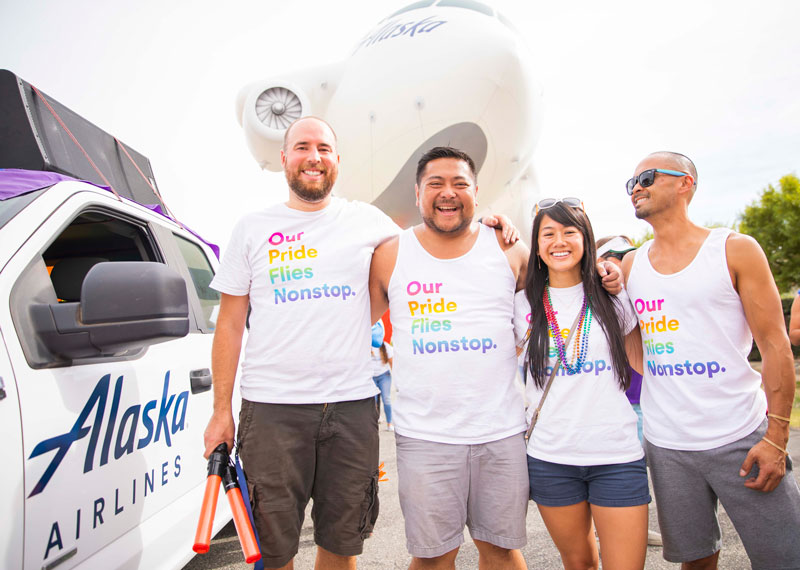
60,000 airplane hats and bandanas to pass out as swag.
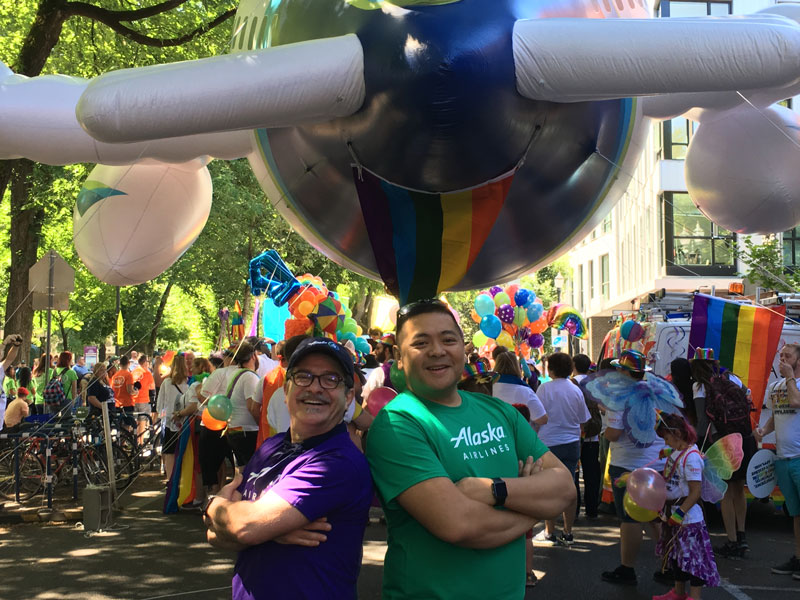
9,000 pounds of equipment, including a plane-shaped mega-balloon.
More than 1,000 hours in donated time, sweat — and sometimes, tears.
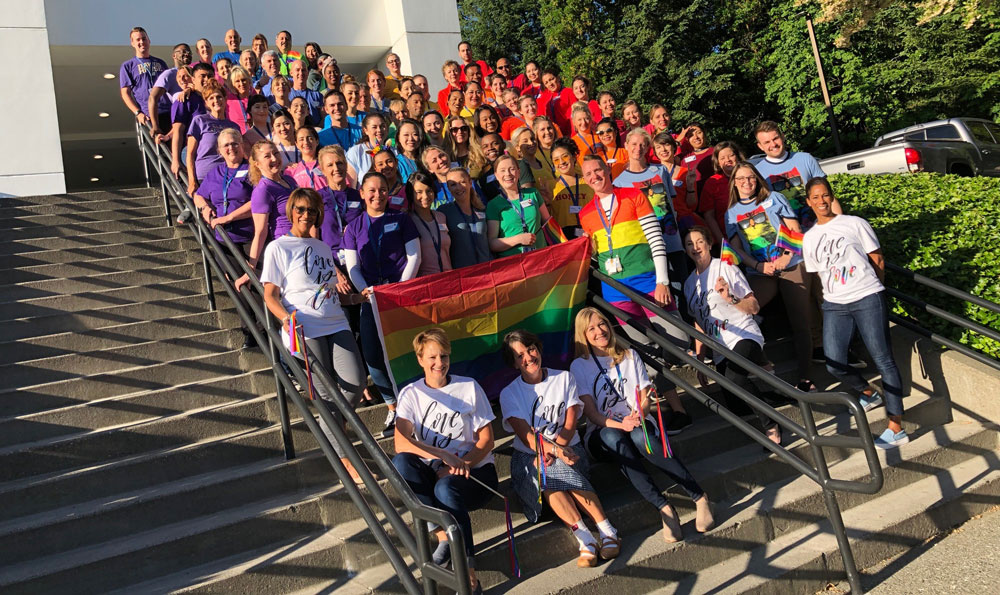
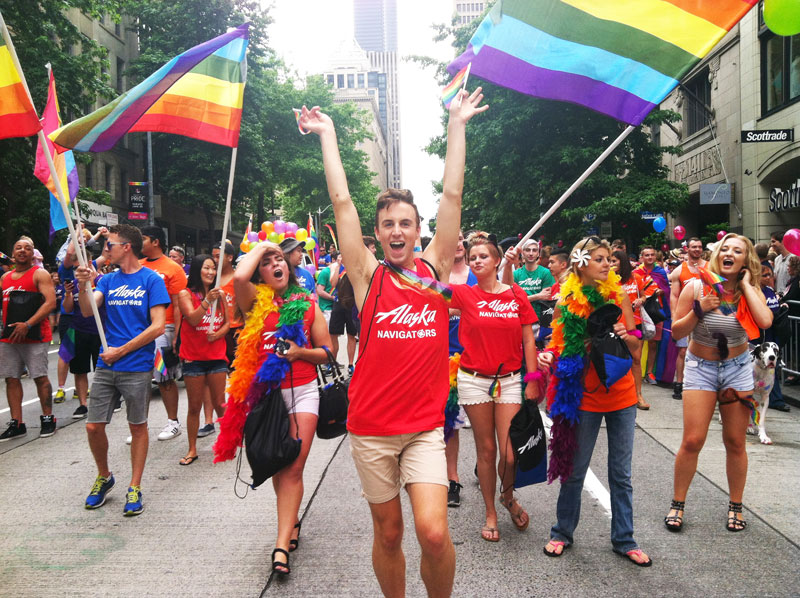
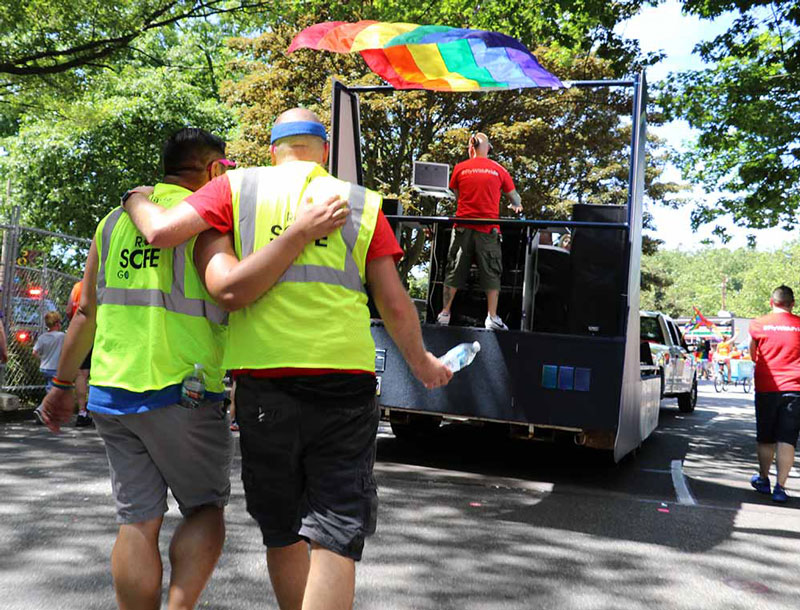
But when hundreds of Alaska Airlines employees’ efforts come together at marches and festivities across the country, the Pride itself is unquantifiable. “From the start, this has been people who wanted to walk in the parade and be proud for our company and be proud that the company supports us,” says Chad Gabagat, workforce specialist and co-leader of the Gay Lesbian or Bisexual Employees resource group (GLOBE), which helps organize Alaska’s Pride parade appearances.
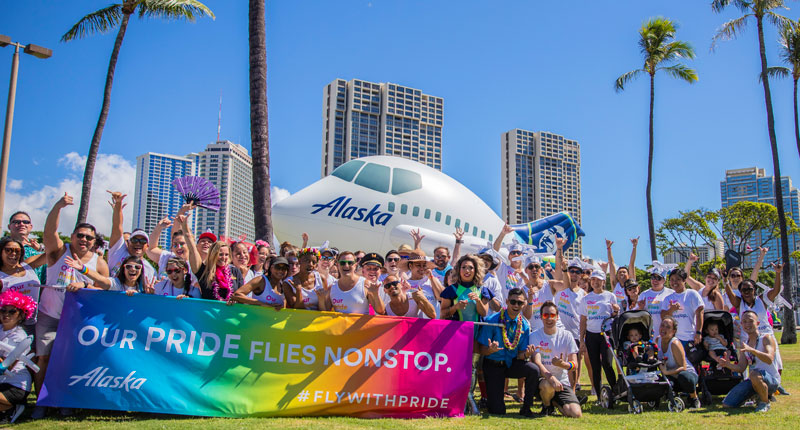
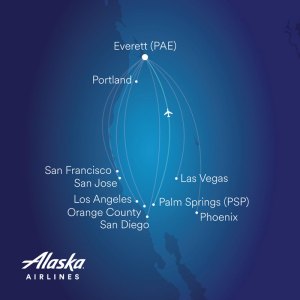
This year, Alaska has official partnerships with seven parades and employee groups will march in at least nine cities, starting in Portland on June 16. Anchorage follows on June 29, and the biggest parades Alaska sponsors — Seattle and San Francisco — both land on June 30, creating a West Coast logistical puzzle for GLOBE leaders as they choreograph floats, music, T-shirts and water for about 500 volunteers. San Diego’s march is just two weeks later on July 13, while Honolulu and Palm Springs parades come in the cooler fall months. (See the full schedule and details for the parade partnerships.)
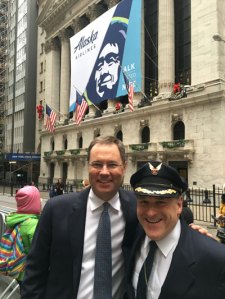
Alaska will once again be the official airline of its hometown Seattle parade. “Alaska will help lead this year’s parade,” says GLOBE co-leader Kevin Larson, who manages the cargo call center and central baggage teams. “That means a lot to the thousands of Alaska Airlines employees who call Seattle home.”
“It is truly inspiring to see our people leading on behalf of equity and inclusion in our communities,” says Andy Schneider, Senior Vice President of People. “I’m so proud and humbled by the time commitment, passion and focus our employees have in representing our company throughout the communities we serve.”
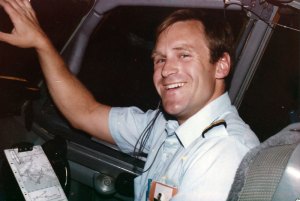
This is the 14th year employees will represent Alaska in Seattle’s parade. The first appearance in 2006 was inspired by the parade’s move from the Capitol Hill neighborhood to the heart of downtown — and the news that it would be televised. Rick Wise, an IT project manager who has worked at Alaska for 32 years, remembers making the pitch to company executives. “Other companies that were marching were the cool companies in town — Amazon, Microsoft, Nordstrom,” he says. “We’re one of the cool companies, too. We did not want to be left out.”
Wise points out that some employees had marched unofficially in previous Pride parades — but the group wanted executives’ blessing to carry the Alaska banner and wear the logo. “Being lower on the organization chart, we were nervous going to the officers,” he says. “We had our facts, and we were prepared to probably be denied.”
But executives said yes. “It was like they were waiting for someone to come forward and make the request,” Wise says.
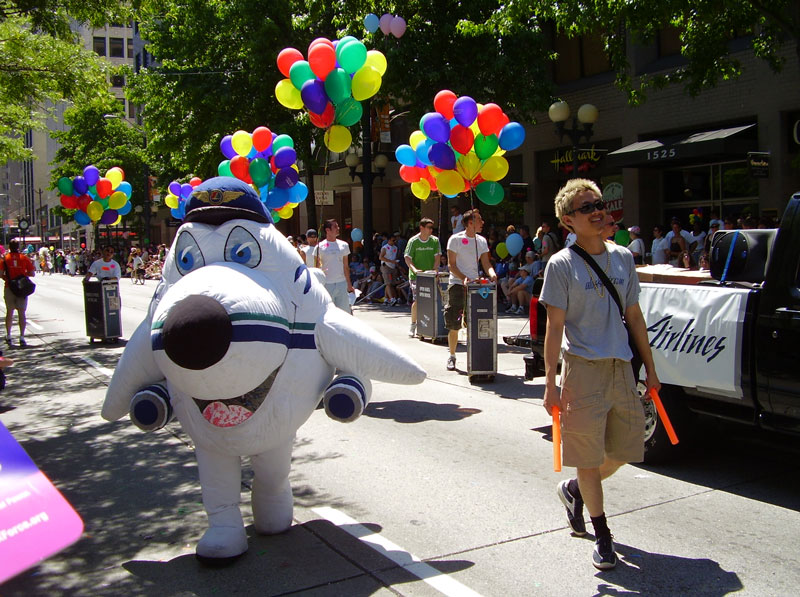
That first year, the 40 or so marchers, including Wise and Gabagat, wore whatever Alaska logo shirts they had. They borrowed a few broken beverage carts to push and handed out swag — some magazines, bags of peanuts and other trinkets. Larson was one of the employees watching from the crowd. “I knew I wanted to be a part of it,” he says.
Larson now runs logistics for the seven official parade appearances, creating two-year budgets and down-to-the-minute timelines for volunteers to follow. All GLOBE members donate their time — and for the core group handling setup and teardown, that means 24 hours of heavy lifting apiece spread over each parade weekend. “We have our day jobs and our gay jobs,” Larson says.
Gabagat admits the work to coordinate the parades can be exhausting, and sometimes thankless. But then he gets emails like this from fellow employees: “They say, ‘My son or daughter just came out. I want to walk in the parade.’ That sort of thing gets me every time,” he says. “It’s so meaningful to include not just our employees who are LGBTQ, but also those with kids who are LGBTQ. They know their company supports them and their families.”
Though sponsorships are not possible in every city, Wise encourages employees who want Alaska to participate in their city’s parade to create a plan and reach out to GLOBE leaders for guidance. “In the early years, we were afraid, but we went forward and asked,” Wise says. “If you want something, don’t wait for someone else to do it. A small group can make things happen.”
Related story: On Alaska flights, sit back and enjoy the Pride
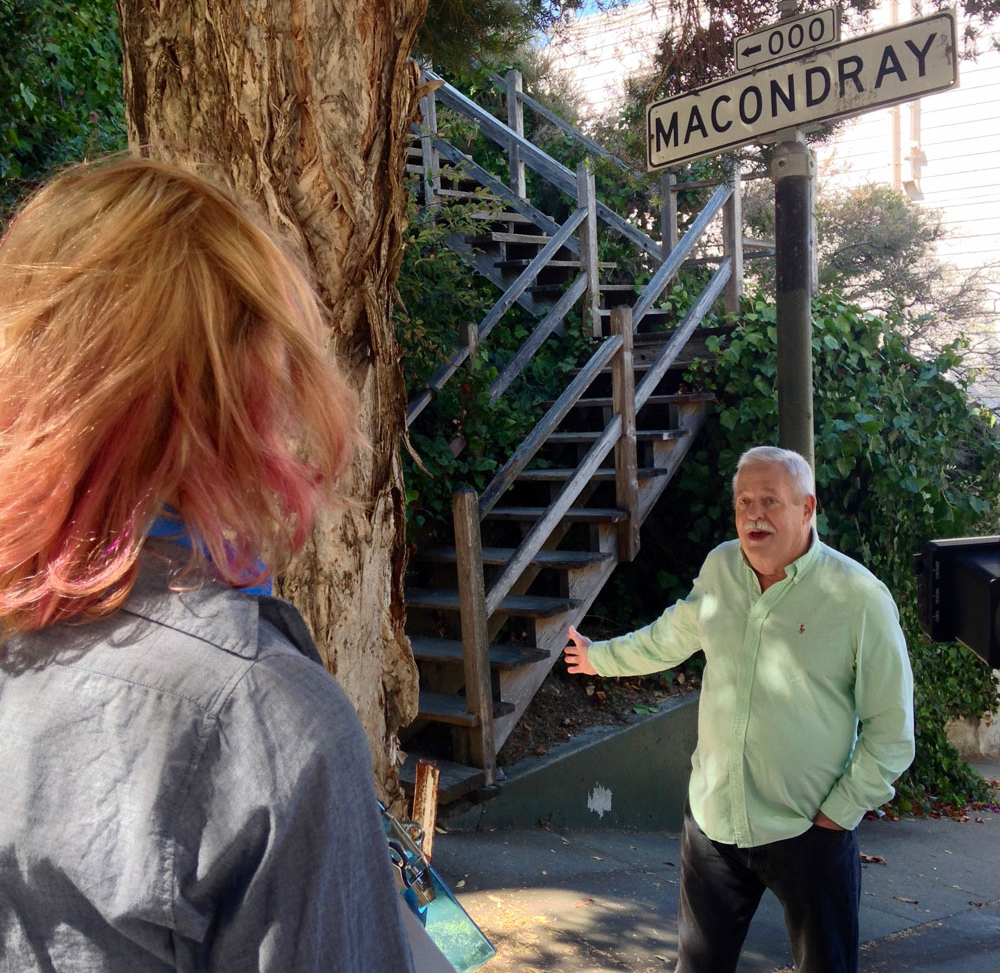
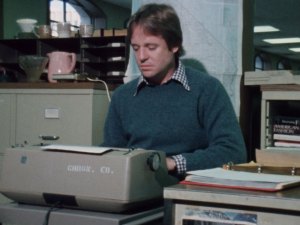
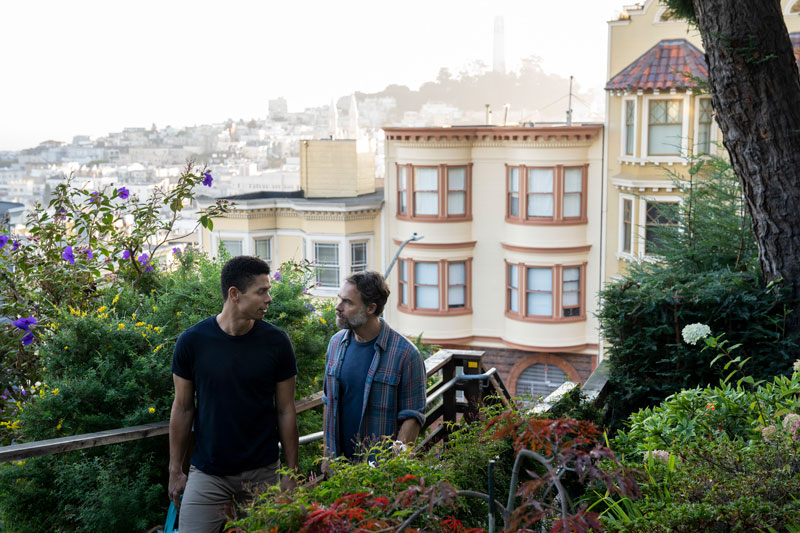
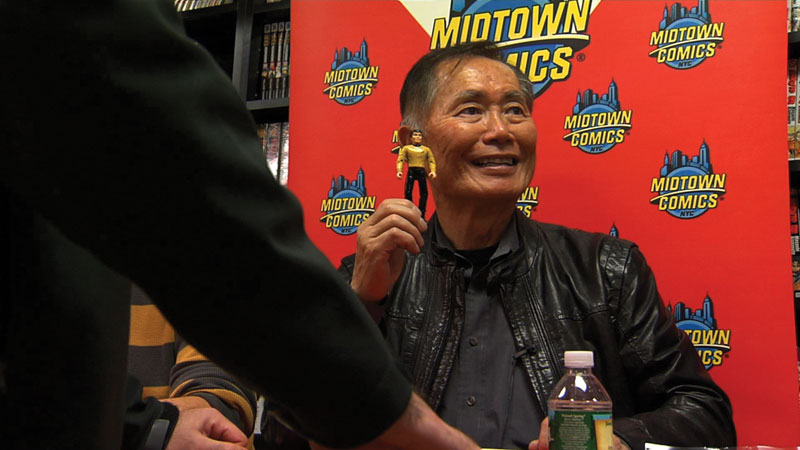
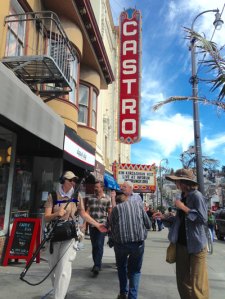
As part of Alaska’s sponsorship of Pride 2019 celebrations, the free inflight entertainment during June and July features 18 films from the LGBTQ+ media-arts nonprofit Frameline, including two documentaries by director Jennifer M. Kroot: “The Untold Tales of Armistead Maupin” and “To Be Takei.” Maupin and Kroot recently spoke with us about the films and shared some of their favorite places in San Francisco. Read more.


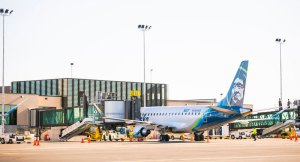
 The start of service at Paine Field overall is a big hit – from the ease of getting to the airport, to the luxurious comfort of the new terminal, to the quick boarding process. As of late May, more than 160,000 passengers have flown with us at Paine Field.